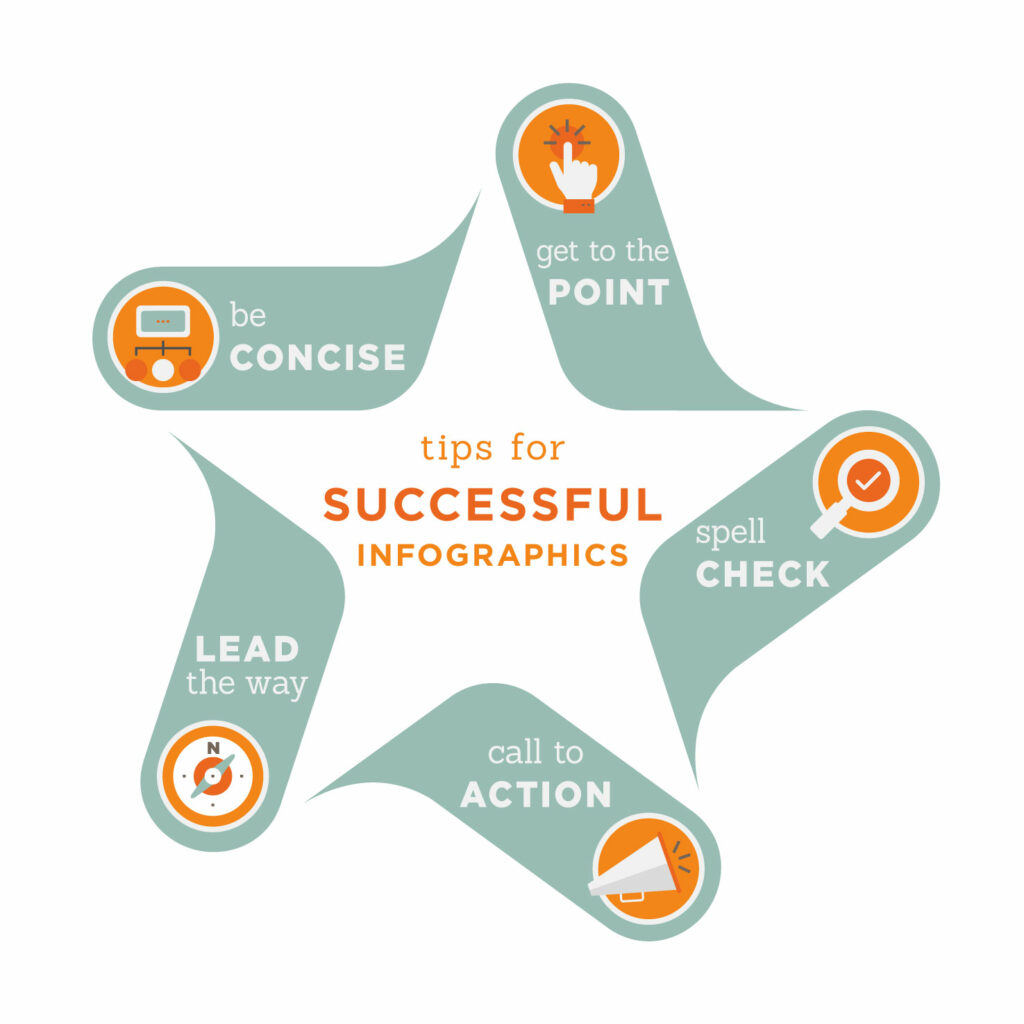
Infographics… everyone seems to be talking about them these days, but what are they? Why do you need them? Simply put, infographics display information with graphics (see what we did there? No?). Complex data and processes can often be more impactful if they are displayed visually. A picture is worth a thousand words and all that… but when are they appropriate? How can they be used? Read on for an intro to your new favorite graphic tool.
What kind of information can I show in an infographic?
The short answer is… anything! Any data that can be visually displayed with minimal text is appropriate for an infographic. The key is making sure your graphic is serving a purpose. If it is not conveying the idea that you are trying to get across then it isn’t effective – that’s where the “info” part of the infographic comes in. The main purpose of data visualization is to help your audience quickly understand the material you are presenting to them.
For some infographic examples, take a look here.
What type of graphic do I need?
Charts, graphs, illustrations, and even motion can all work together to tell a data story. The type of infographic depends on the information that you are portraying. A simple pie chart may work, or you may need a more complex illustration. When we begin a custom infographic, one of the first steps in our process is to assess the types of graphics that make sense for a particular data set. How can we distill the information and tell the right story in the simplest way?
If an infographic requires a large amount of text to explain the concept, it is likely not working. A truly successful infographic will be easy to understand and digest because it links the data to graphics, allowing the viewer to make connections quickly.
What kind of applications can I use infographics for?
The great thing about this style of graphic is that it can be used in many different ways. In fact, one infographic can often be used for multiple purposes. Marketing materials, ad campaigns, presentations, social media… infographics can be useful across media. There are, of course, design considerations specific to the media you are using, but infographics are generally flexible enough to work in several areas with minimal tweaks.
How can infographics work within my brand?
Infographics are a great way to showcase your brand. They can be used to introduce new elements while keeping the overall look consistent with your company identity. It’s important to consider how your infographic works in relation to your other marketing pieces. It may introduce a new way of displaying information, but it should also maintain your brand’s visual standards in relation to colors, typefaces, etc.

5 things all successful infographics have:
- Get to the point. Any part of the graphic that is not contributing to the primary objective is unnecessary.
- Spell check! There’s nothing worse than undermining your authority with a misspelled word. You may be the expert on your data, but you won’t look like one with spelling or grammatical errors.
- Lead the way. Don’t let your viewer wander aimlessly looking at pretty pictures. A successful infographic will lead the eye from point to point and control the narrative.
- Call to action. If the goal of your data is for the viewer to do something (donate, make an appointment, adopt a pet, join a gym…), make sure you are making that action clear and direct.
- Be Concise. Keep your text to a minimum – if it’s not pertinent, let it go.
Do you have a project that may benefit from data visualization and infographics?
Call us at 678-773-0523 or send an email to nicole@annattocreates.com to talk through your options.


