2019 Sustainability Report for an International Mining Company
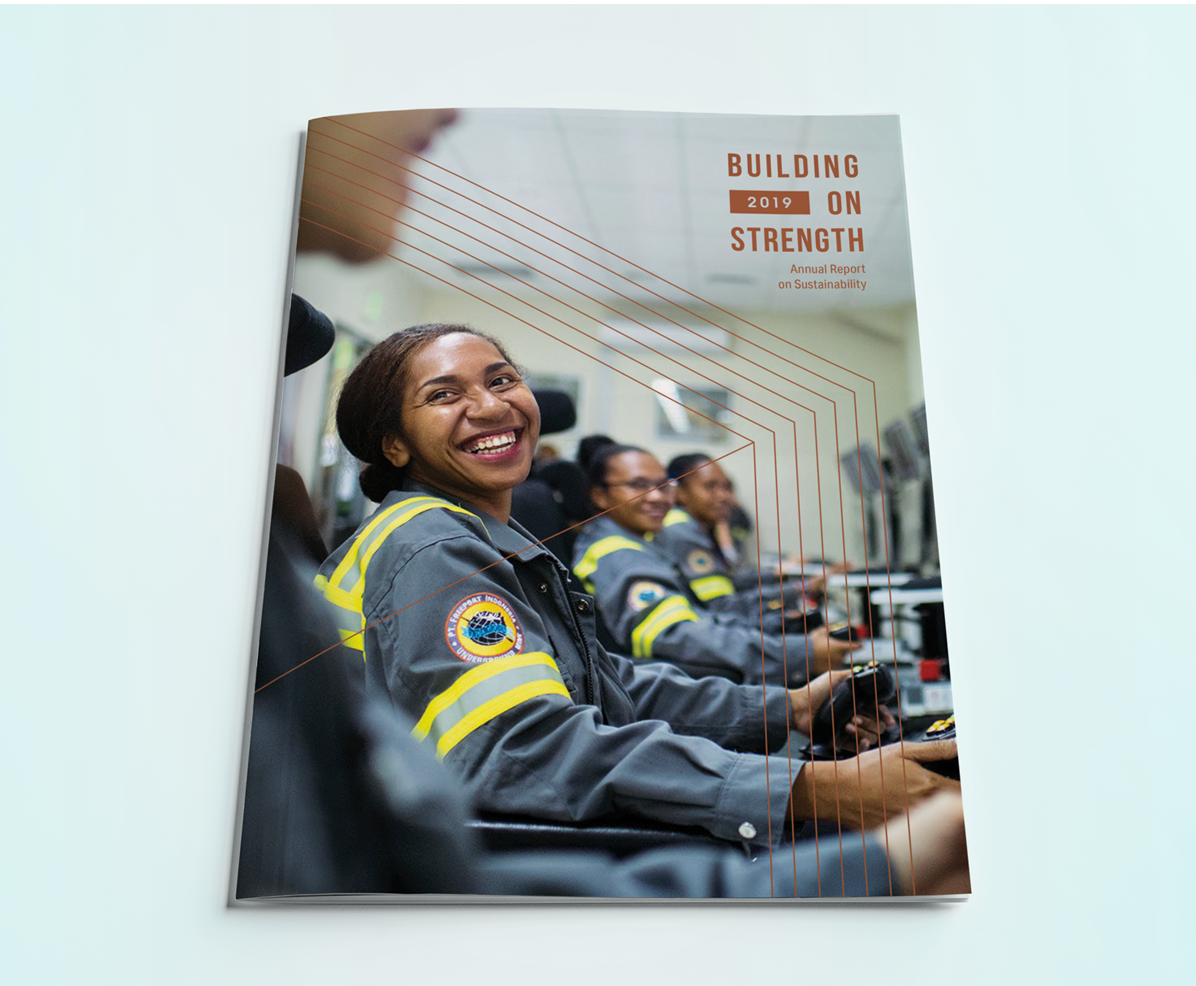
As a leading responsible copper producer, this company publishes a Sustainability Report each year. With a long history of robust sustainability programs, this report shows stakeholders the progress made throughout the year as well as best practices and community involvement.
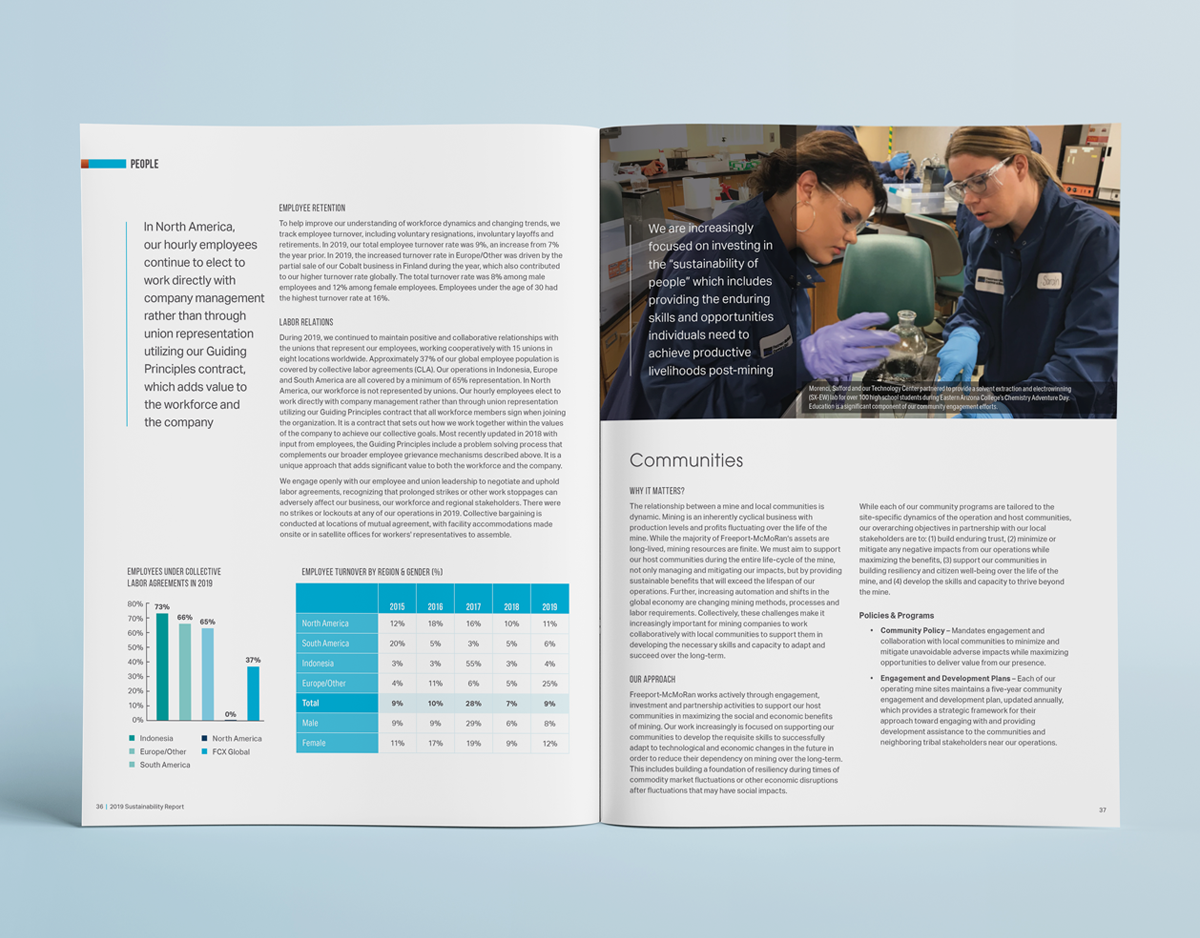
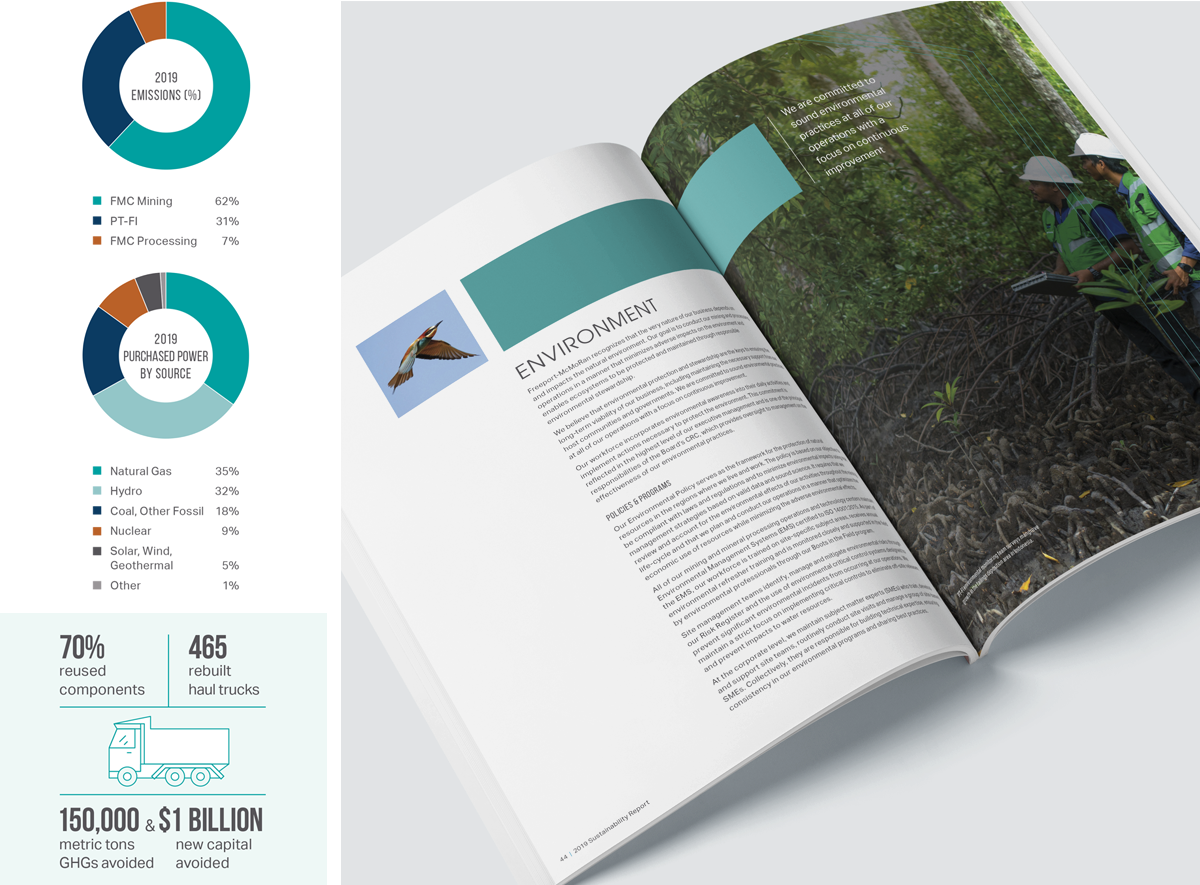
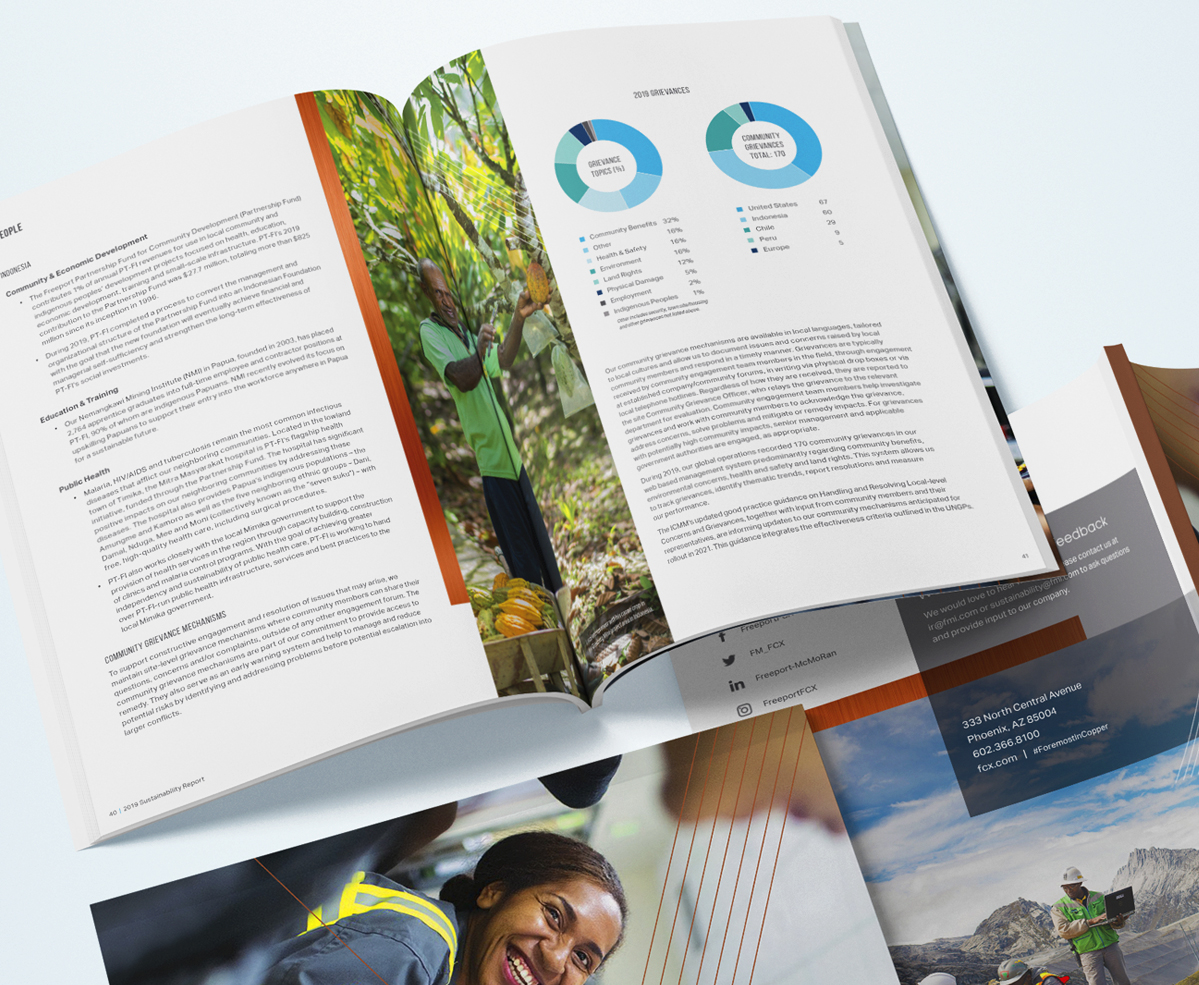
Defining and visualizing large amounts of data made this project challenging. A clearly organized hierarchy of information was essential to keep the viewer from becoming lost in the data. Charts, tables, and infographics were created to break down complex data into visual representations.
The final project, a 76-page book, was delivered to stakeholders in both print and digital formats. In addition, the data graphics were provided in a web-ready format for use on their website.
